Dashboard
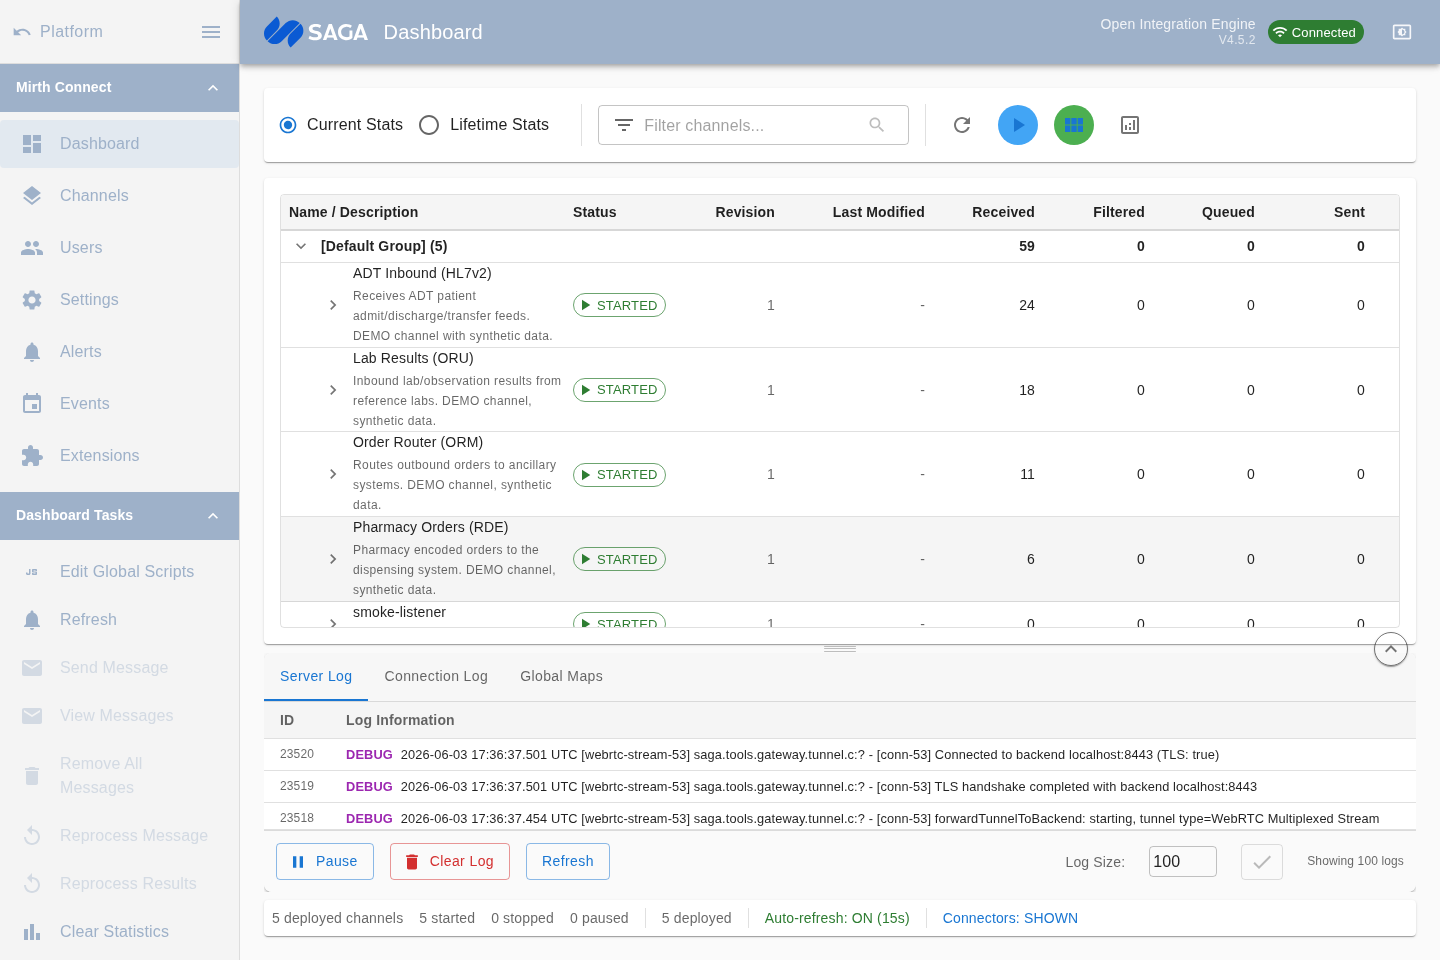
The Dashboard is the default landing page after sign-in. It lists every channel deployed on the server in a tree table, grouped by channel group. Statistics refresh automatically every 15 seconds while the tab is visible.
Channel table
Section titled “Channel table”Each row shows one channel with the following columns:
| Column | What it shows |
|---|---|
| Name / Description | Channel name, optional description, and any assigned tags |
| Status | Current state: Started, Stopped, or Paused |
| Revision | The deployed revision number |
| Last Modified | Date the channel configuration was last saved |
| Received | Messages accepted by the source connector |
| Filtered | Messages dropped by a filter rule |
| Queued | Messages waiting to be sent by a destination |
| Sent | Messages delivered successfully |
| Error | Messages that ended in an error state |
Current vs. lifetime statistics
Section titled “Current vs. lifetime statistics”Toggle between Current Stats (since the last statistics reset) and Lifetime Stats (since the channel was first deployed) using the radio buttons above the table.
Filtering channels
Section titled “Filtering channels”Type in the filter field and press Enter (or click the search icon) to narrow the list by channel name, description, or ID. A chip shows the active filter; click the X on the chip to clear it.
Starting, stopping, and pausing
Section titled “Starting, stopping, and pausing”Each channel row has inline Start, Stop, and Pause buttons. You can also right-click any row for a context menu that supports bulk operations across selected channels.
Connector details
Section titled “Connector details”Click the expand toggle on a channel row to reveal its source and destination connectors, each with their own per-connector statistics. Use the connector visibility button in the toolbar to show or hide connectors globally.
Log panel
Section titled “Log panel”A resizable log panel sits at the bottom of the page. Drag the divider to resize it, or use the expand/collapse button at the right of the divider. The log shows recent server-side output for the connected session.
Status bar
Section titled “Status bar”The footer shows a summary: total deployed channels, how many are started / stopped / paused, total queued messages, and whether auto-refresh is active.
Visualization dashboard
Section titled “Visualization dashboard”Click the chart icon in the toolbar to open the Visualization Dashboard, which provides graphical analytics views for channel throughput and message trends.