Events
The Events page shows the Mirth Connect server event log — an audit trail of significant actions taken by the engine or by users. Use it to investigate deployment failures, review user activity, or troubleshoot unexpected behavior.
What gets recorded
Section titled “What gets recorded”Events cover a broad range of server activity:
- Channel deployments and undeployments
- Channel starts, stops, and pauses
- User logins and logouts
- Configuration changes (settings, users, alerts)
- Extension installs and uninstalls
- System-level errors and warnings
Each event has a level: Information, Warning, or Error.
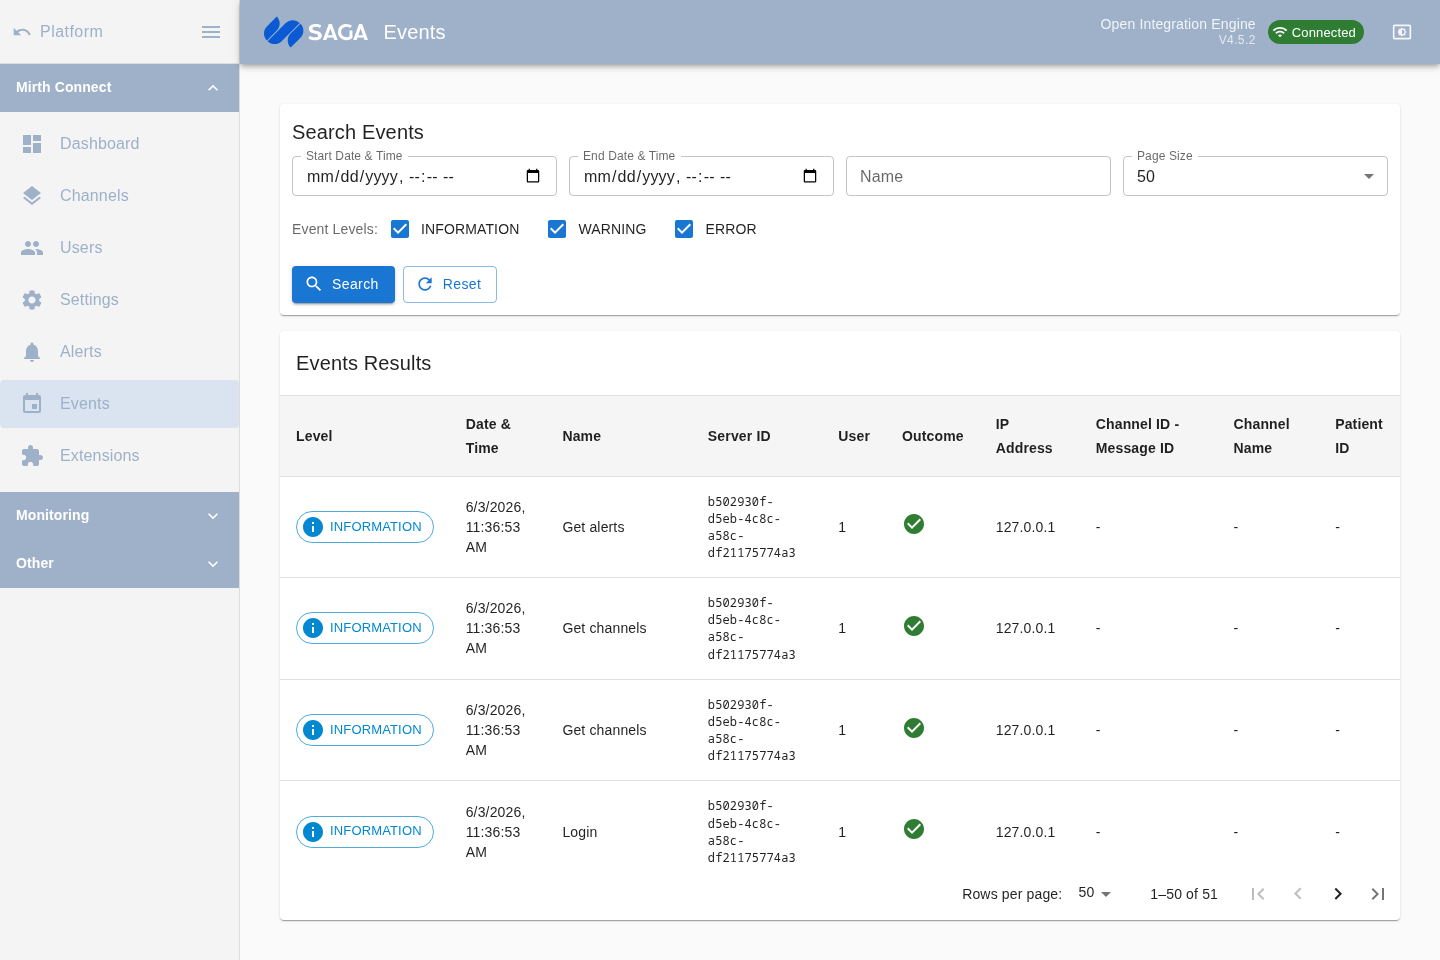
Searching events
Section titled “Searching events”Use the search panel to filter the event log:
| Filter | Description |
|---|---|
| Start date / End date | Restrict to events within a time range |
| Name | Text search against the event name |
| Level | Toggle Information, Warning, and/or Error levels |
| Page size | Number of results per page (default 50) |
Click the search button to execute the query. Results are paginated; use the page controls to move forward and back.
Viewing event details
Section titled “Viewing event details”Click a row in the list to select it. The details panel (or a side panel depending on layout) shows the full event record, including:
- Event name and level
- Timestamp
- Attributes — key/value pairs specific to the event type (for example, which channel was deployed, which user performed an action, or what error was raised)
For error-level events the attributes typically include a stack trace or error message that helps pinpoint the cause.
Event retention
Section titled “Event retention”The server retains events according to its database storage limits. Older events are not automatically purged by default — configure data pruning in Settings → Data Pruner if disk usage is a concern.