Fleet dashboard
The Fleet Monitoring page gives you a single view across every Mirth server that has cloud sync enabled — online status, current health vitals, and active alert counts, updated in real time. It is the cross-server view, and you reach it from the Contact System app. The other pages in this section (alert rules, destinations, analytics) configure and explore a single server at a time.
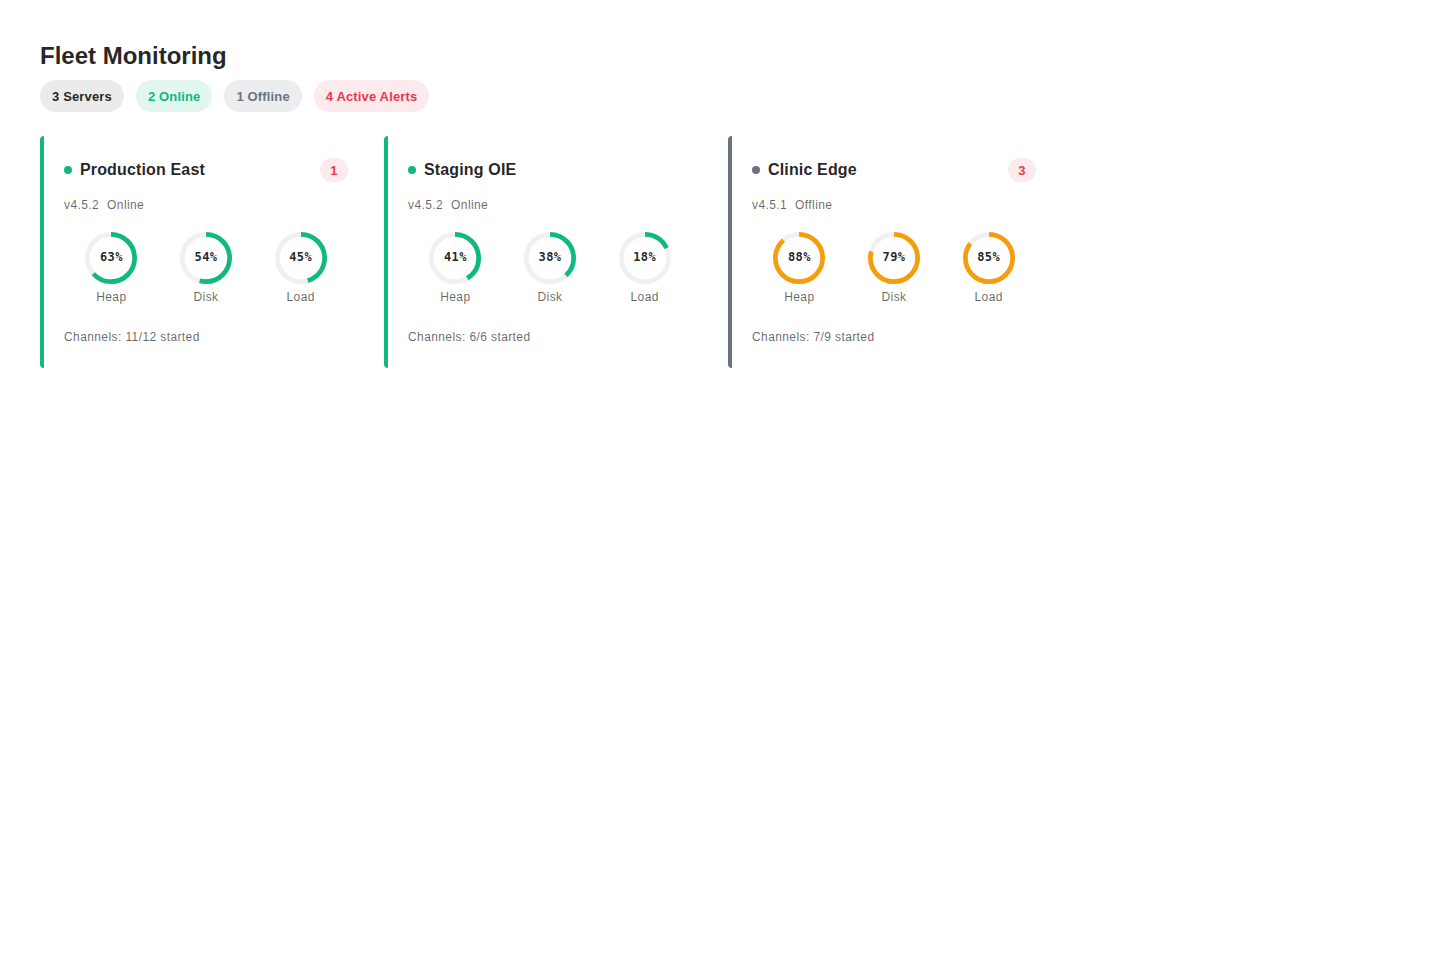
Summary bar
Section titled “Summary bar”At the top of the page, a row of chips summarises the fleet at a glance:
| Chip | What it shows |
|---|---|
| Servers | Total registered servers |
| Online | Servers currently reporting health data |
| Offline | Servers not reporting |
| Active Alerts | Sum of unresolved alerts across all servers |
The Offline and Active Alerts chips highlight in amber or red when counts are non-zero so problems stand out immediately.
Server cards
Section titled “Server cards”Each server appears as a card. A coloured left border and a pulsing dot indicate online (green) or offline (grey) status. The card shows:
- Server name and current Mirth version
- Heap, Disk, and Load gauges — circular indicators that shade yellow above ~70% and red above ~90%
- Channel summary: how many channels are started out of total configured
- Alert badge: a pulsing red count badge when the server has active alerts
Click any card to open the server detail view.
Server detail view
Section titled “Server detail view”Selecting a server drills into a three-section page:
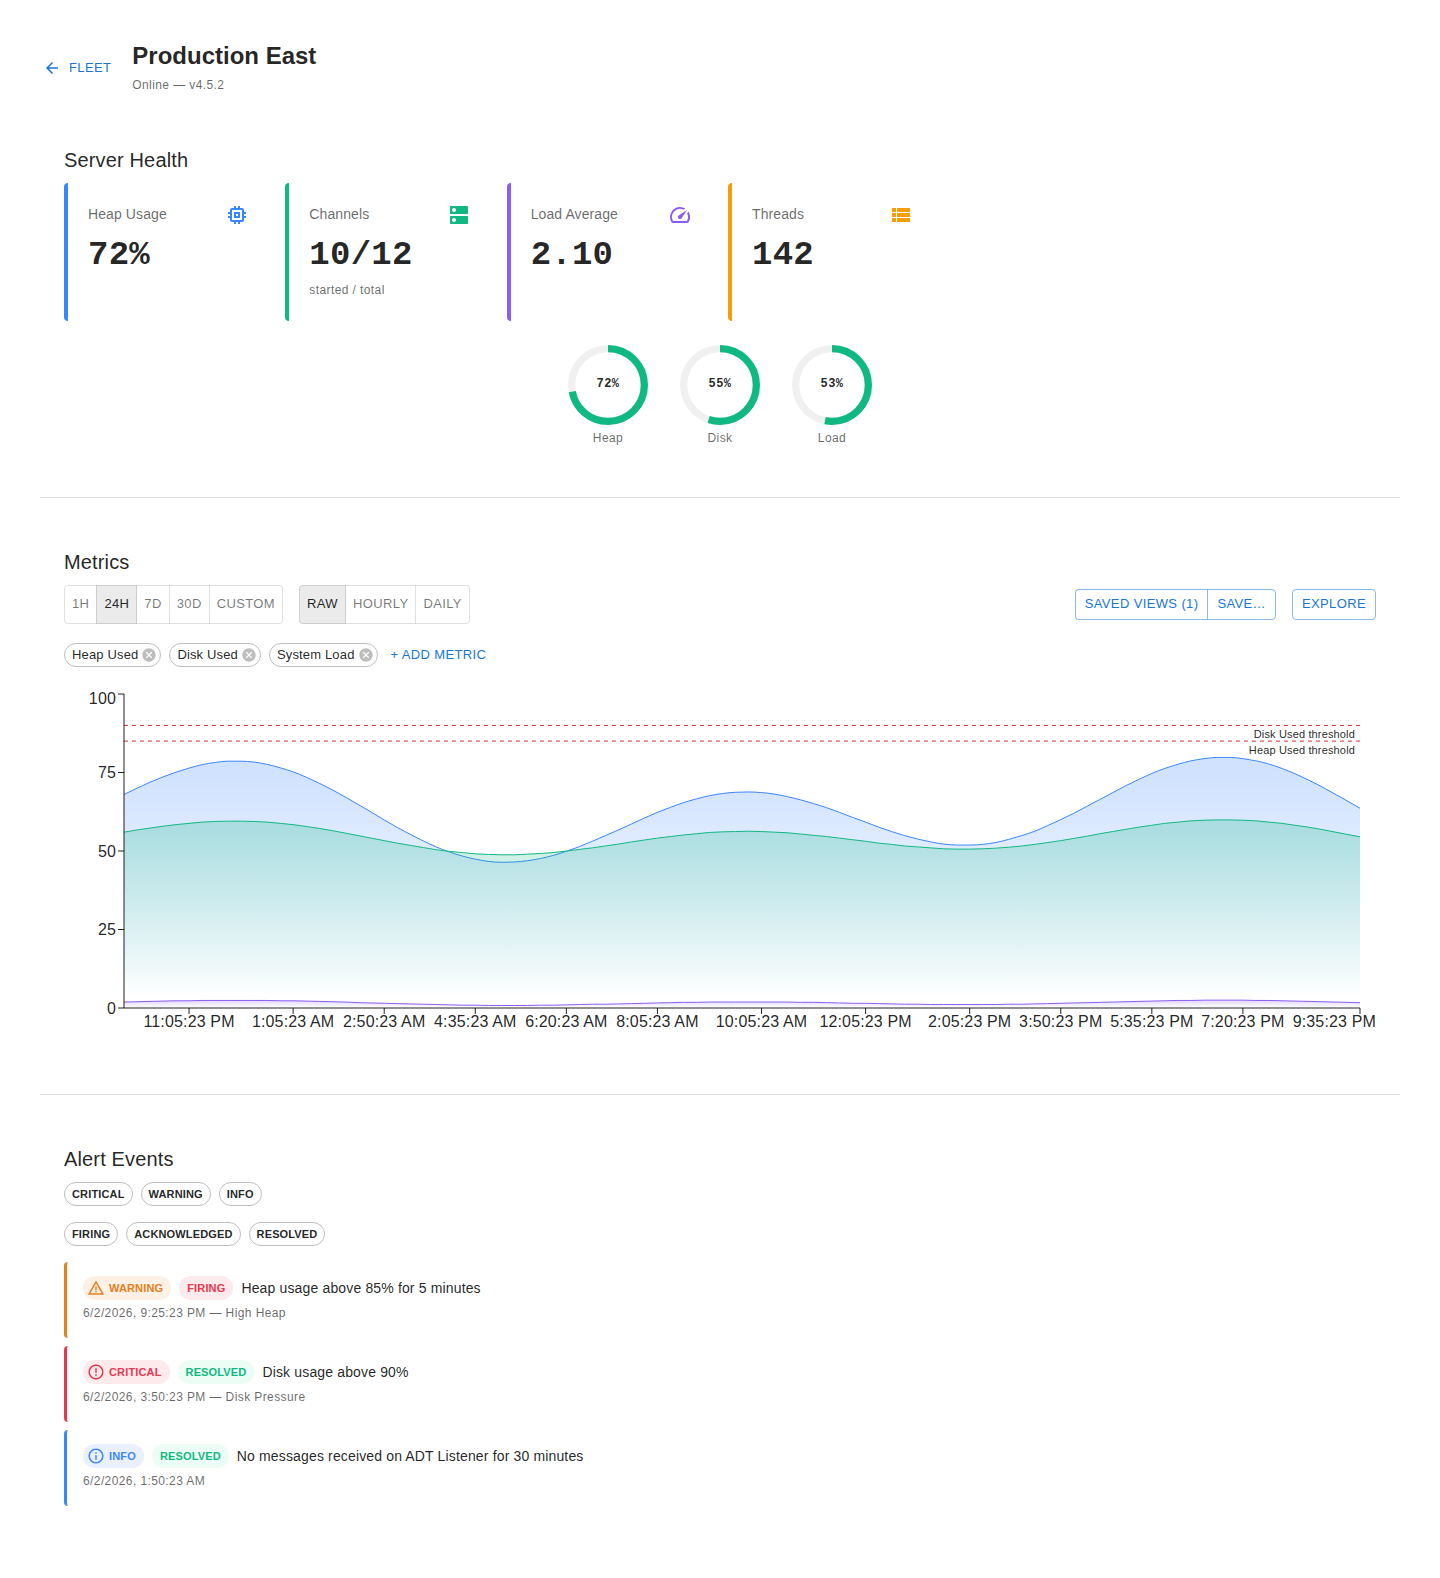
Server Health
Section titled “Server Health”Stat cards for Heap Usage, Channels (started/total), Load Average, and Threads, plus the same heap/disk/load gauges as the fleet card but at full size.
Metrics
Section titled “Metrics”The metric explorer lets you chart any available metric over time. Select a time range (1 h, 24 h, 7 d, 30 d, or custom), pick raw or rolled-up granularity, and add or remove metrics from the chart. Hover a metric chip to highlight its line. You can save frequently used combinations as named views.
Alert Events
Section titled “Alert Events”A timeline of alert events for this server. Filter by severity (Critical, Warning, Info) and state (Firing, Acknowledged, Resolved). Expand any event to see the rule that fired, the condition, and the scope. Click View this metric to jump the explorer directly to the relevant metric at the time of the event.
PHI safety
Section titled “PHI safety”Monitoring collects only numeric metrics and operational state — counts, percentages, timestamps, and channel lifecycle events. Message content is never accessed, stored, or transmitted. You can monitor freely without PHI exposure risk.